Why the latest tax cuts feel small, why the pressure remains, and why race belongs in the center of the story rather than the margins
By Charles Rollins, Publisher, Garden City Gossip
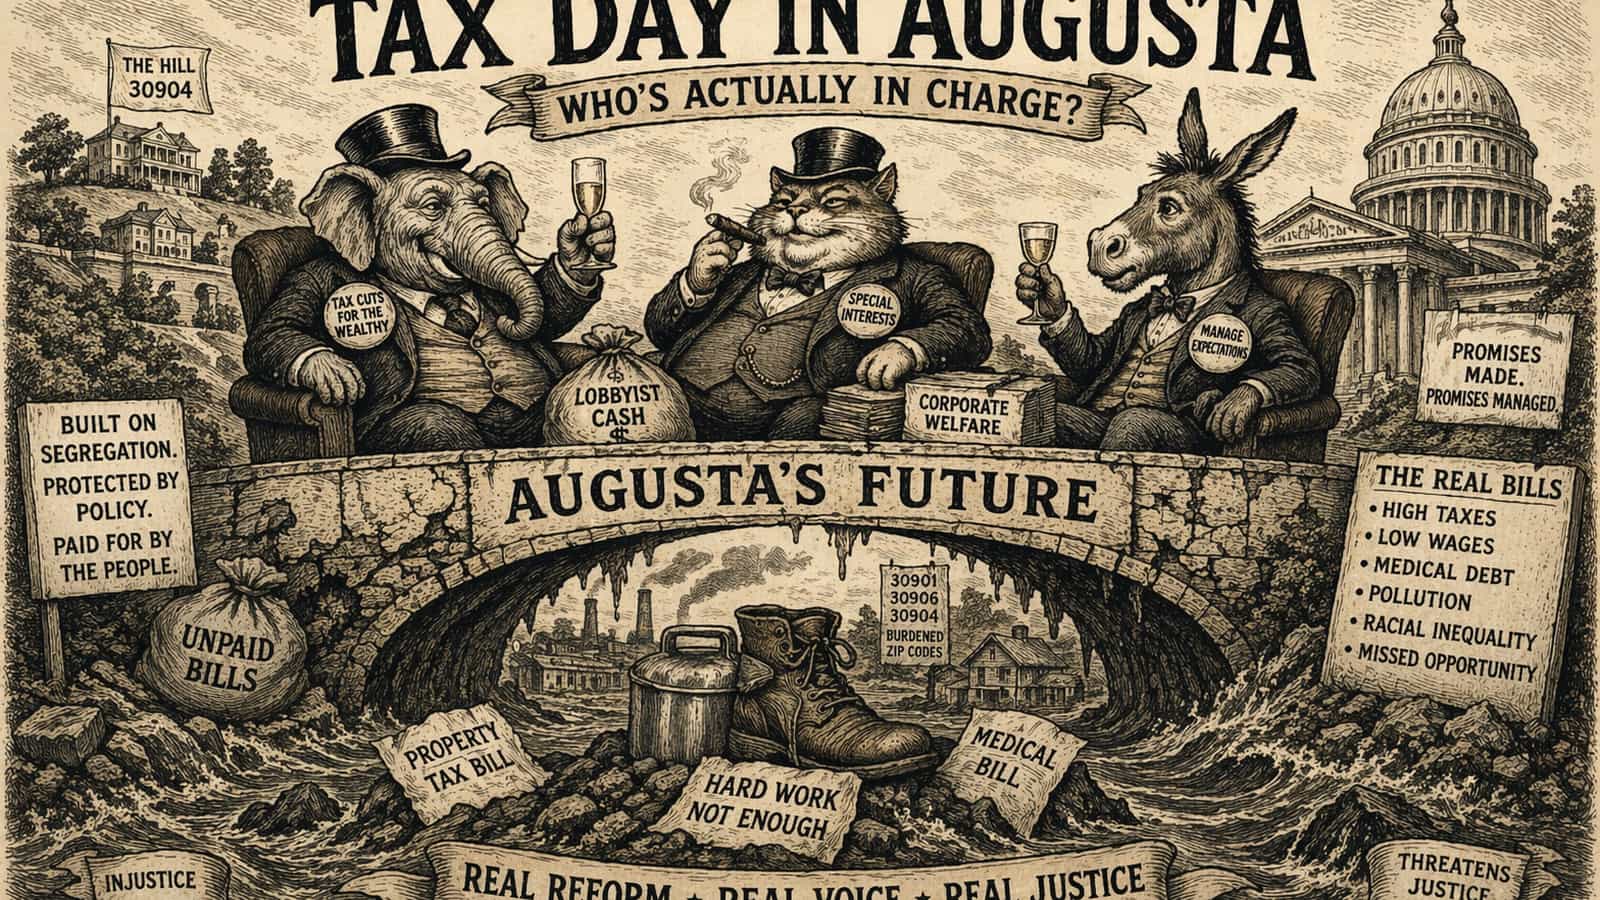
Tax Day invites a very American form of misdirection. Politicians speak of “relief.” Accountants speak of compliance. Cable television speaks of winners and losers. Everyone gestures toward the Internal Revenue Code as though it were the central text of the country’s economic life, and as though wages, rent, health insurance, medical debt, payroll withholding, child care, transportation, bargaining power, asset ownership, and pollution were merely the scenery around it.1
That has it backward. The tax code matters enormously, but not because it stands apart from the rest of the economy. It matters because it helps organize the rest of the economy: what counts as income, which forms of income receive favored treatment, whose earnings are visible to the state, whose liabilities are easy to enforce, whose security is routed through an employer, and whose risks are left to households to absorb. If the latest Republican tax law had solved the affordability problem, Richmond County would not look the way it does on April 15, 2026. And if the Democratic answer to that problem had ever been more than partial, the broader architecture would not still feel so familiar.2
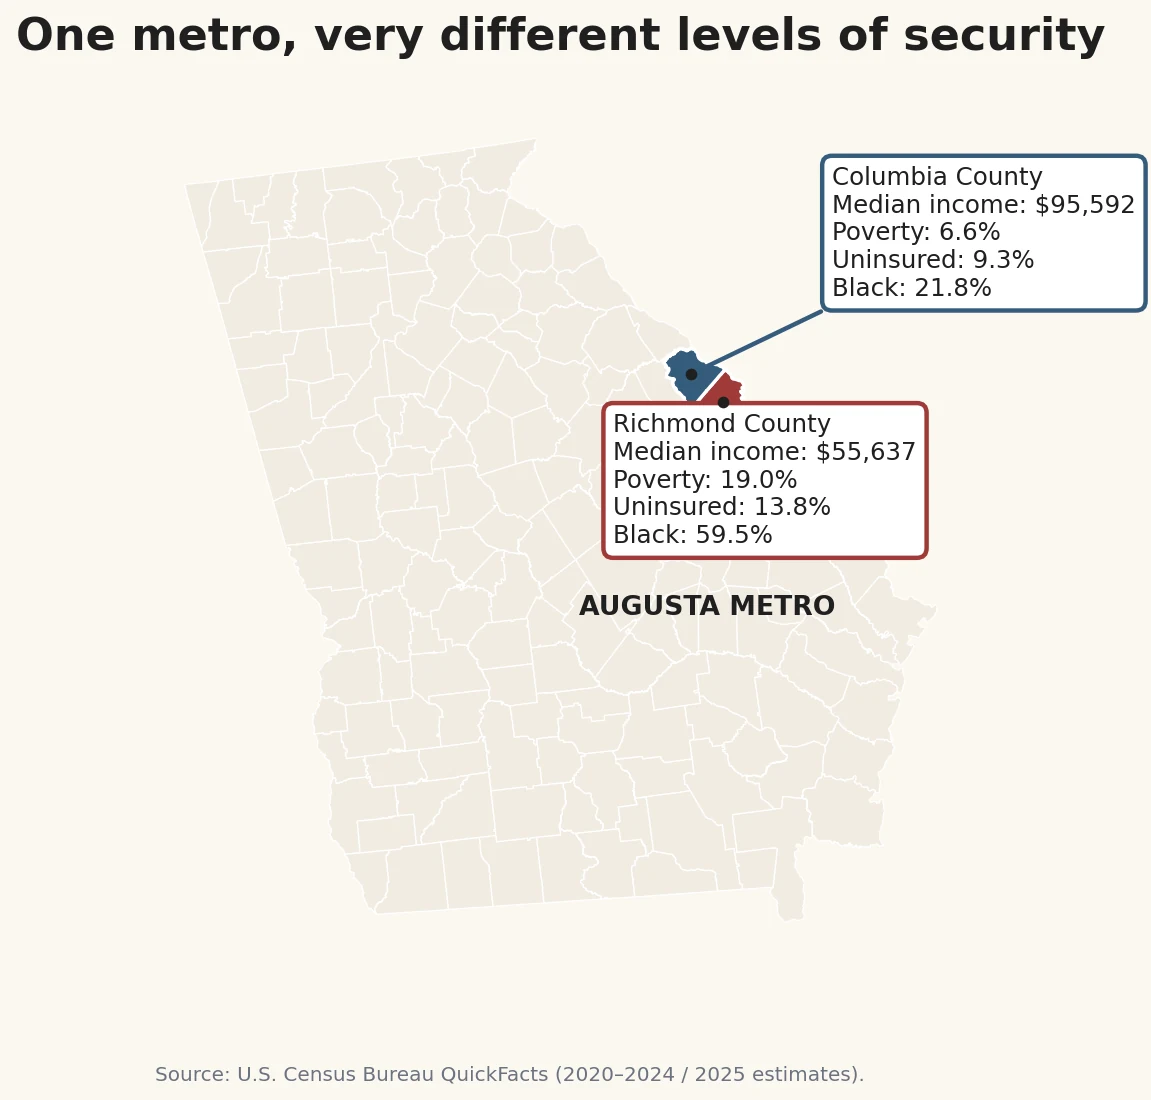
The local numbers are not subtle. Richmond County is 59.5 percent Black, only 3.8 percent foreign-born, has a median household income of $55,637 in 2024 dollars, a poverty rate of 19.0 percent, and an under-65 uninsured rate of 13.8 percent. Columbia County, a few miles away in the same metropolitan area, is wealthier, whiter, more insured, and faster growing. Its poverty rate is 6.6 percent. Its under-65 uninsured rate is 9.3 percent. Its median household income is $95,592. One metropolitan area, one labor market, one broad state policy environment, and very different levels of insulation from ordinary risk.3
That local contrast is a better guide to the national story than most campaign rhetoric. Americans are not generally confused about the fact that they are under pressure. They are often quite accurate about that. What they are consistently misled about are the causes. They are told to blame inflation in the abstract, or one president, or one bill, or one villain of the week, or immigrants, or “greedy corporations,” or the moral defects of the poor, or the decadence of elites, or some other fragment severed from the structure that gives it meaning. In Richmond County, where the foreign-born share is so low, the current right-wing habit of blaming immigrants collapses under the most basic local facts. The older grammar of blame remains much closer to the truth of local politics: anti-Black suspicion, the moral policing of poverty, the sanctification of hierarchy, and the constant effort to redescribe structured inequality as personal failure or unfortunate necessity.4
So this essay begins with Tax Day, but it is not really about filing. It is about the system beneath the filing ritual. It is about why the most recent tax revisions have felt so slight to so many people; why affordability is experienced not as one bad month but as a chronic condition; why Augusta remains a particularly vivid place in which to see the structure at work; and why race cannot be treated as a side issue in a city and region built by racial ordering. If the language turns sharp at moments, that is because the evidence warrants it. One does not need to read hearts to describe a structure honestly. If a policy’s discriminatory effects are predictable, documented, and sustained after warning, calling it racist is description, not excess.5
The wrong explanation
The first deception in American economic rhetoric is almost always semantic. We still talk about poverty as if the decisive question were whether a family owns certain durable goods: a refrigerator, a television, a car, a smartphone. This is supposed to settle the matter. The poor, we are told, are not really poor if they possess the ordinary objects of modern life. The claim has always been intellectually flimsy, but it remains politically useful because it turns a question of security, status, and power into an inventory question.6
The more serious literature says something quite different. Relative-deprivation research has long treated poverty not as sheer starvation but as lacking the resources necessary to participate in the ordinary patterns of one’s own society. Public-health research makes a parallel point: health inequity grows out of the unequal distribution of power, resources, and institutional access, not merely from the private choices of individuals. Research on subjective social status reaches a similar conclusion from another angle: the way people locate themselves relative to others has a strong relationship to well-being. In plain English, a household can own the minimum equipment of contemporary life and still be poor in the only sense that matters socially—namely, insecure, subordinated, and exposed.7
That is why the familiar comparison between an American family and a family in the global south almost always misses the point. A refrigerator in rural Malawi and a refrigerator in Augusta do not mean the same thing economically or socially. The relevant question is not whether both households possess a cooling appliance. The relevant question is what each household must command in order to participate with dignity in the society it actually inhabits: housing, health care, transportation, education, child care, ordinary leisure, and some plausible margin of safety against shocks. Poverty in a rich country is measured against the costs of belonging to that country.8
Measured that way, a great deal of American economic distress becomes easier to understand. The Federal Reserve’s latest household survey found that only 63 percent of adults said they could cover a $400 emergency expense with cash or its equivalent. That is a useful figure because it measures not aspiration but slack. A household can look provisioned from the outside and still be operating without slack: one transmission failure, one emergency room visit, one lapse in hours, one rent increase, one child-care disruption away from crisis.9
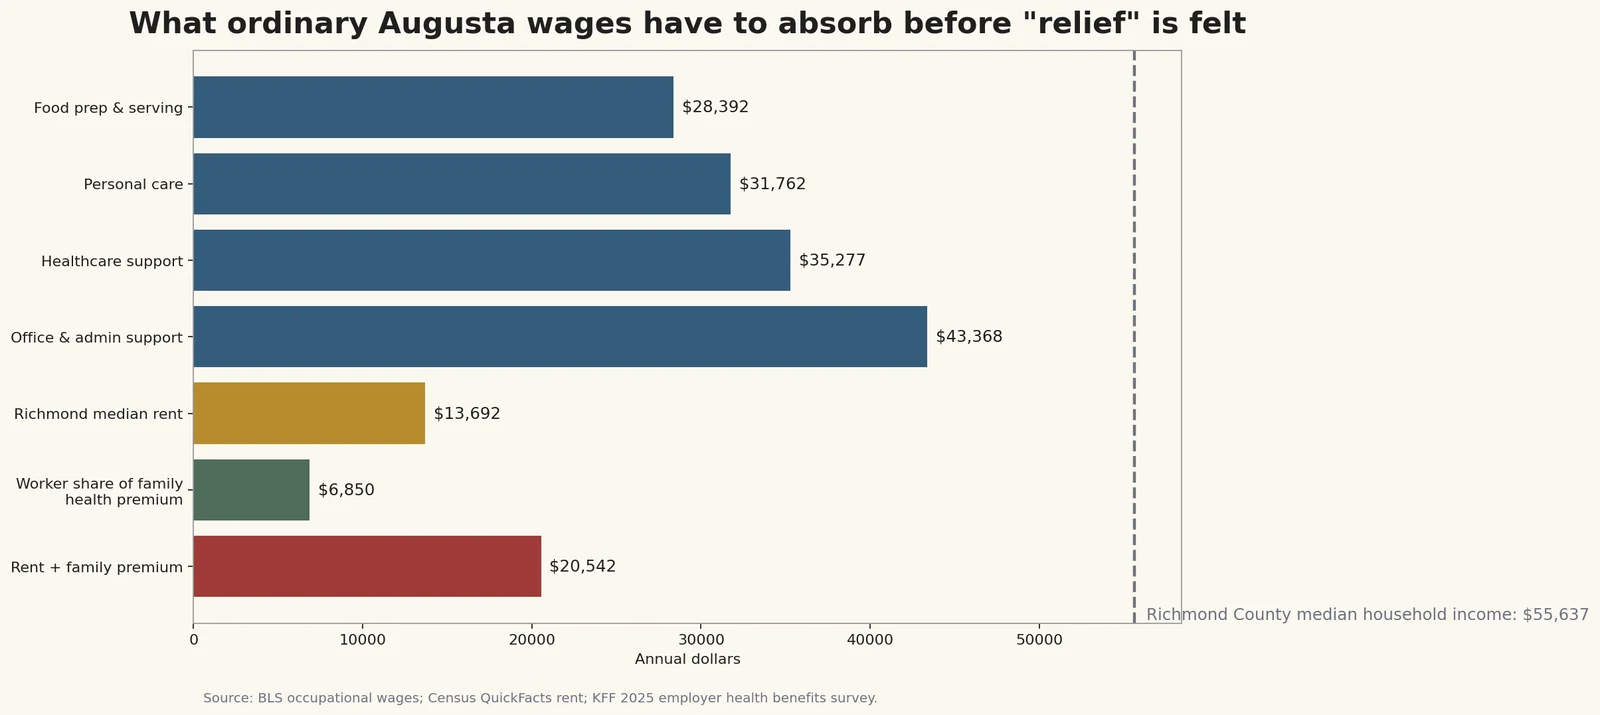
Local wage and housing data make the point even more plainly. In the Augusta metropolitan area, average hourly pay in food preparation and serving is $13.65. Healthcare support workers average $16.96. Personal care workers average $15.27. Office and administrative support, the largest occupational group locally, averages $20.85. Richmond County’s median gross rent is $1,141. Median monthly owner costs with a mortgage are $1,382. If one begins from those figures rather than from press releases about “relief,” the affordability question looks less mysterious. The household budget of a family built on wages like those is not simply an exercise in discipline. It is a map of exposure.10
The structure beneath the squeeze
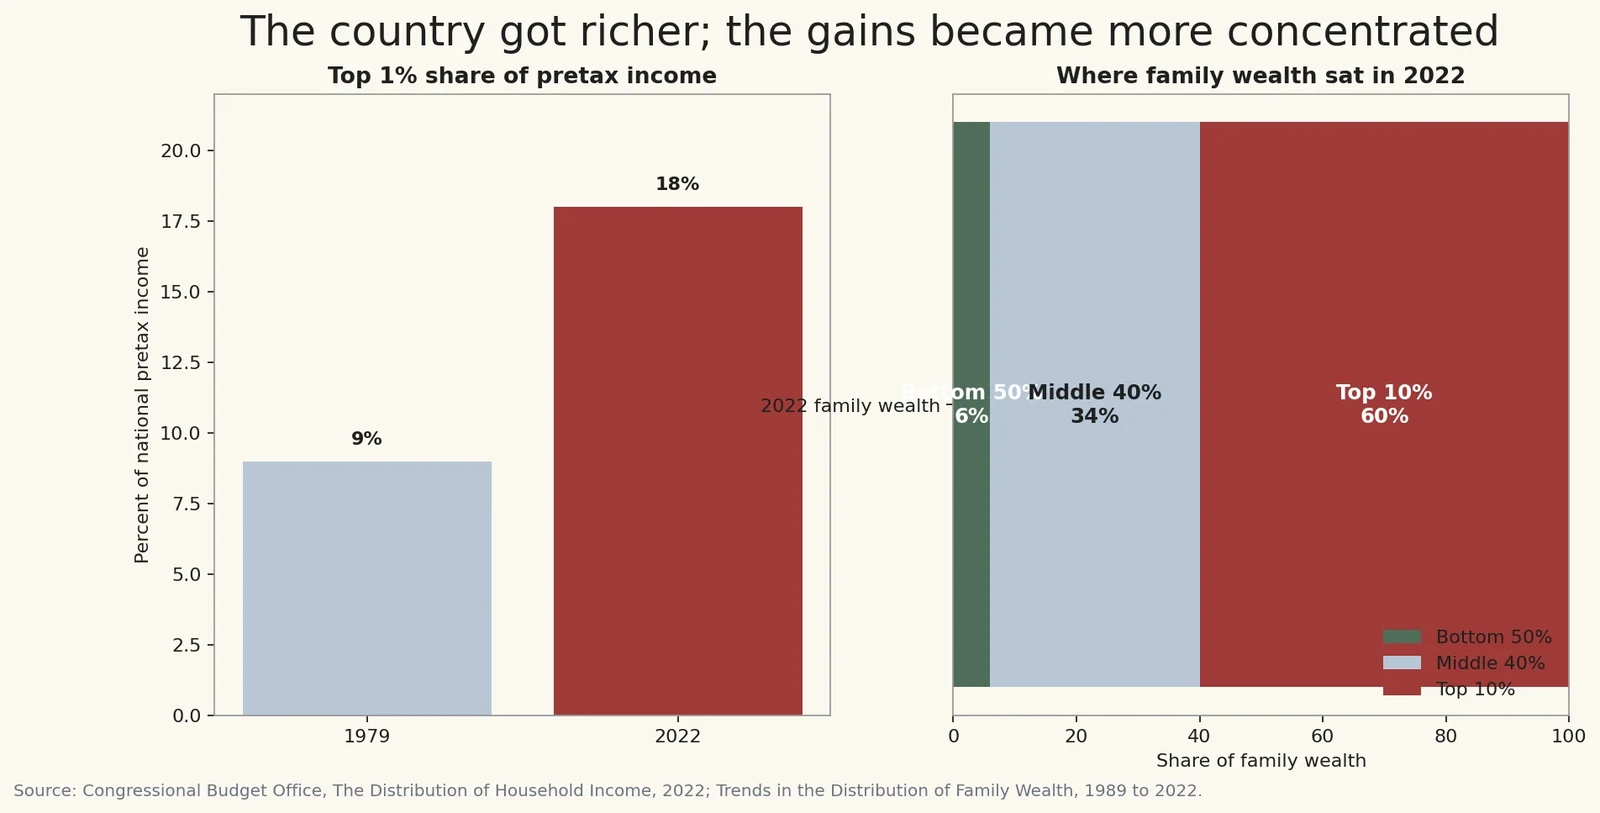
The United States did not fail to become wealthy. It became richer than ever. It also became much more unequal. Those two facts are not contradictory; they are the basic pairing of the last forty years.11
The Congressional Budget Office reports that from 1979 to 2022, the share of income before transfers and taxes going to the top 1 percent doubled, from 9 percent to 18 percent. Over a similar period, total family wealth rose sharply in inflation-adjusted terms, but remained highly concentrated: by 2022 the top 10 percent held 60 percent of all family wealth, the top 1 percent held 27 percent, and the bottom half held just 6 percent. If Social Security wealth is excluded, the concentration is harsher still. The country did not stop producing wealth. It concentrated more of that wealth into ownership positions that produce insulation, leverage, and political voice.12
Pew’s work on the middle class describes the lived side of the same shift. The middle-income share of the population fell from 61 percent in 1971 to 51 percent in 2023, while upper-income households grew as a share of the population and captured a larger share of aggregate household income. The more revealing point is not merely that the middle thinned numerically. It is that the middle lost relative command over the national income stream while the top gained it.13
There are many causes behind that shift—deunionization, financialization, deregulation, changes in corporate governance, the weakening of pensions, housing scarcity, the decline of labor power. Tax law is not the only cause. But it is one of the main ways the system decided which forms of income to reward, which forms of wealth to protect, and which forms of inequality to normalize. Thomas Piketty’s useful point is that inequality is not simply a market outcome; it is sustained by institutions and by the stories societies tell to justify them. Daron Acemoglu’s useful point is similar from another angle: institutions decide who captures the gains of economic life and who does not. Those arguments matter here because the current affordability debate is still presented as though distribution were a natural result rather than a political settlement.14
The most important hidden distinction in that settlement is not just high income versus low income. It is labor income versus ownership income. The code already treats them differently. Long-term capital gains receive preferential rates. Appreciation can be deferred. Wealth can compound before it is taxed. The tax value of major capital-income preferences flows overwhelmingly to high-income households. IRS researchers have found that capital gains are extremely concentrated—75.7 percent accrue to the top 10 percent and 45.3 percent to the top 1 percent—and that once gains are included, the apparent progressivity of the tax system looks much flatter. Meanwhile, payroll taxes strike wage income from the first dollar and the Social Security portion stops at a statutory cap, which makes that tax less progressive than the ordinary-income schedule makes the system appear at first glance.15
This is why so many official tax stories feel false even when they are not literally false. On paper, a middle-income household may receive some tax reduction. On paper, the latest Republican tax law does cut taxes for most households relative to what would have happened if older provisions had simply expired. Tax Policy Center estimated that about 84 percent of households would receive a tax cut in 2026, averaging about $2,900, but that 60 percent of the benefits would flow to the top 20 percent. And when spending cuts are counted alongside tax cuts, CBO estimates that household resources would actually fall for the lowest decile while rising for the highest. In other words, the slogan “tax relief” is not wholly fictitious. It is simply too narrow to describe what people are actually living through.16
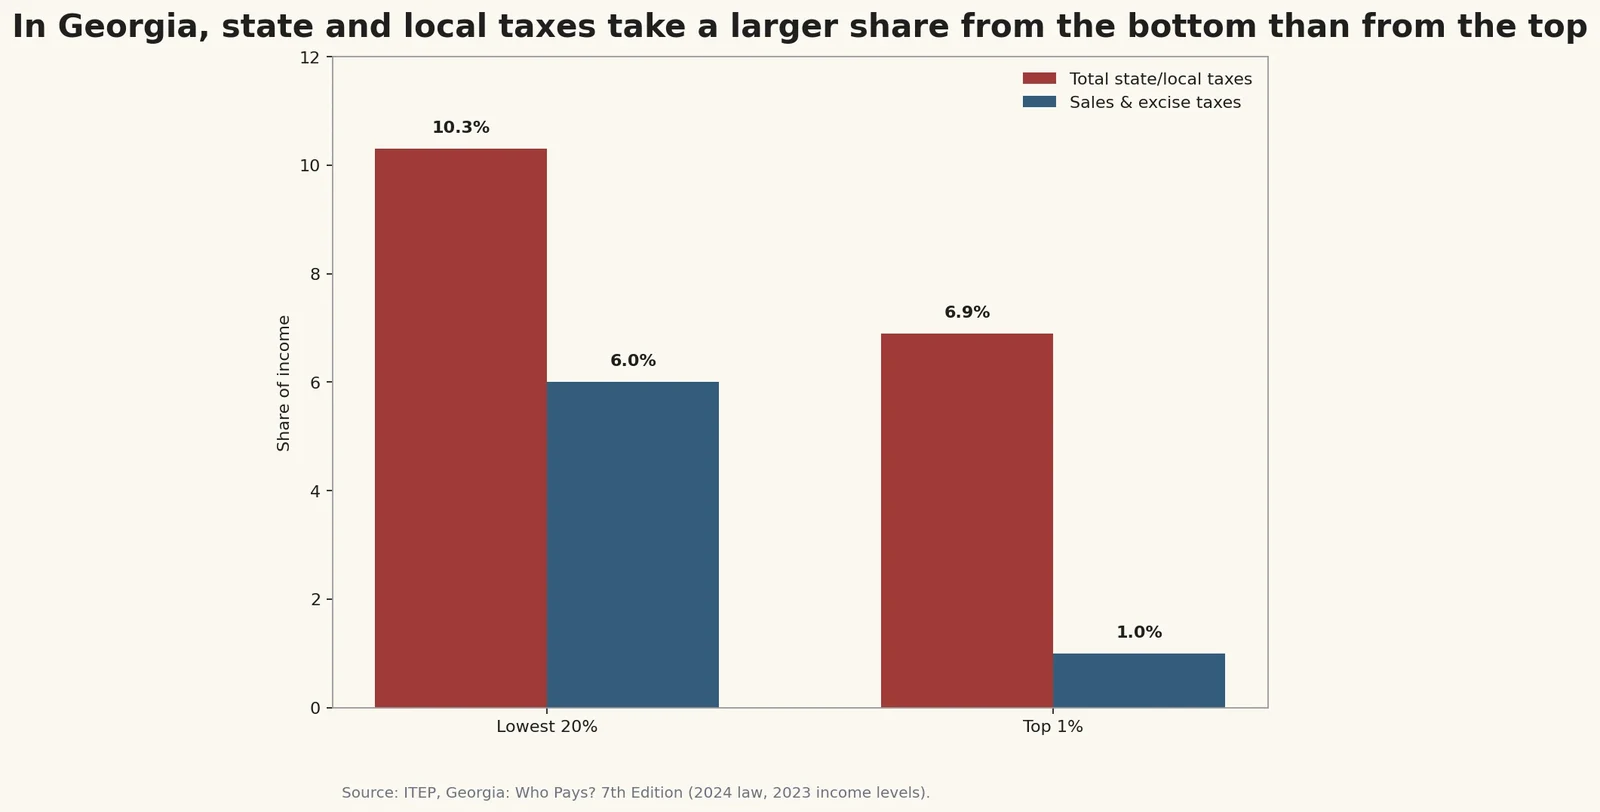
That mismatch becomes even clearer in Augusta. A full-time worker earning roughly $28,000 a year in a local food-service job will feel the world first through wages, payroll taxes, rent, utilities, and consumption taxes, not through sophisticated federal deductions. Georgia’s flat income tax rate is 5.19 percent. Richmond County’s combined sales tax rate is 8.5 percent. FICA takes 7.65 percent from employee wages before one reaches the grocery store. So when a politician says “your taxes went down” and an Augusta voter says “I do not feel any better,” they may both be telling the truth. They are simply talking about different layers of the system.17
Land, race, and the geography of protection
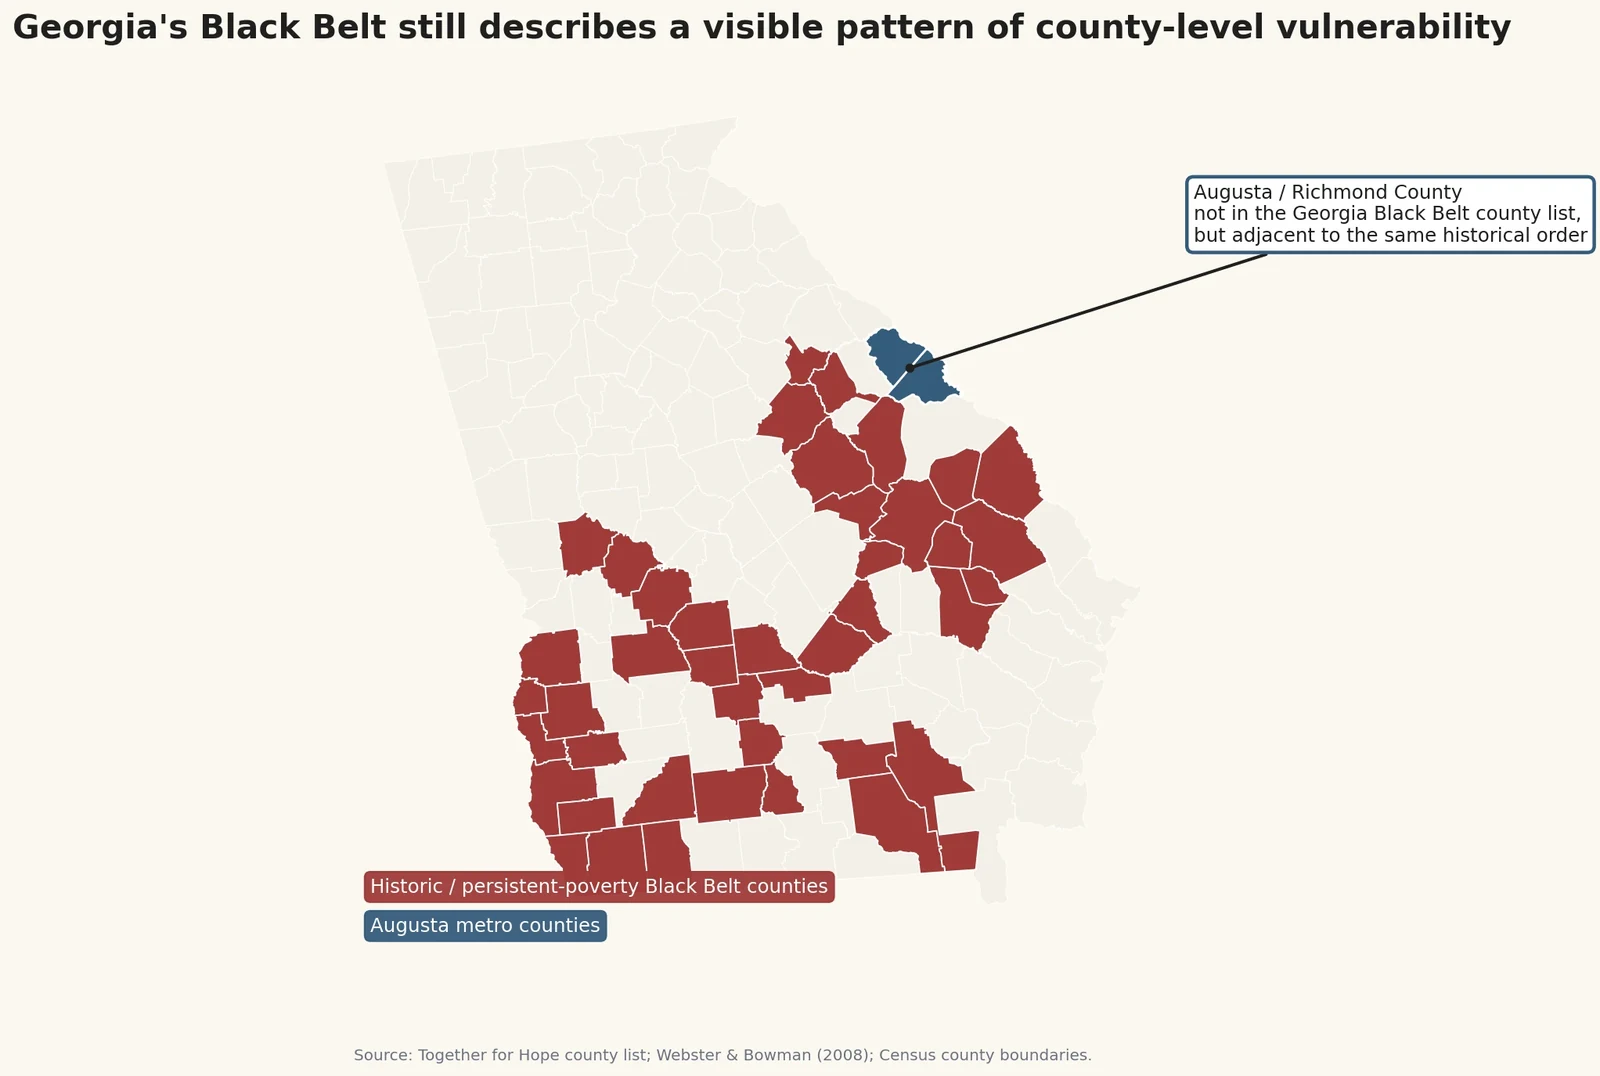
Race enters this story not as an afterthought but as part of the architecture. The cleanest way to see that in Georgia is to begin with the Black Belt and then be careful. The historic Black Belt was first a geological description: a band of dark, fertile soil running through much of the lower Piedmont and deep South. It became, by extension, a political-economic description of plantation counties built on that soil and on enslaved labor. Over time the term expanded further, becoming shorthand for the demography and poverty patterns that followed the plantation system long after emancipation. Augusta should not be lazily collapsed into the narrowest soil map. The point is not cartographic purity. The point is historical continuity. The order built in and around the Black Belt—cotton, coercion, extraction, racial hierarchy, and durable Black poverty—shaped Georgia as a whole, and Augusta built its own urban version of that order on top of it.18
The Hill is one of the city’s clearest local examples. Summerville developed on higher ground west of downtown and acquired a reputation as a healthier environment, above the fevers and humidity associated with the low riverfront. The federal government moved the Augusta Arsenal from an unhealthy site near the river to the Summerville area after a devastating fever epidemic. That history is real. It should also be read more seriously than local nostalgia usually reads it. In Augusta, “healthier” never referred only to mosquitoes. It also referred to who could buy distance from danger.19
That does not mean the Hill should be caricatured. It is a real place, not a symbol in search of nuance. Nor should 30904 be flattened into a single moral category. The Hill is in 30904. So is other terrain. The Sand Hills district includes a historic African American cemetery purchased in 1906 by residents of the Summer Hill/Sand Hills community. The point is not that one ZIP code can be labeled either privileged or burdened and left at that. The point is almost the opposite: Augusta compresses protection and exposure, prestige and vulnerability, into awkwardly adjacent spaces, and the city’s postal containers do a poor job of capturing that complexity.20
That caution matters because Augusta’s contemporary environmental data are often summarized at the ZIP-code level. A 2024 environmental-equity analysis by Savannah Riverkeeper and E2I2 found that 30901, 30904, and 30906 experience the greatest overall burdens among the ZIP codes it studied, and that 30901, 30815, 30904, and 30906 have demographic characteristics associated with historic discrimination, including higher shares of people of color and low-income households. But the report itself warns that census tracts do not align perfectly with ZIP boundaries, so ZIP-level results may include data from tracts that span more than one ZIP. That methodological caveat matters in exactly the way common political argument does not. It keeps us from turning 30904 into a caricature while still allowing us to say something serious: Augusta’s geography of exposure is structured, and it remains entangled with race and class.21
The redlining history makes the structure plainer still. Mapping Inequality’s materials on Augusta show that Black residents were heavily concentrated in some of the city’s HOLC areas, especially the Terry, which was 90 percent Black and was singled out in an earlier survey as a typhoid fever hazard. Area descriptions for D-11 referred to open sewers and “obnoxious odors.” That is not merely a story about bad housing. It is a story about public health, sanitation, finance, race, and the distribution of dignity. When older city documents and lending maps describe Black Augusta in the language of disease and smell, and contemporary environmental data still show heavier burdens in many of the same broad parts of town, it is not melodrama to say that poverty here has long been legible to the nose as well as the ledger.22
I made a first attempt at telling part of this story in an earlier essay for this publication, arguing that Augusta is one body and that the city’s environmental burdens are distributed by history rather than accident. That remains true. The deeper point now is that this geography was never just environmental. It was economic, racial, and fiscal at once. Housing shapes wealth. Wealth shapes taxation. Taxation shapes public capacity. Public capacity shapes infrastructure, schools, sanitation, and the kinds of risks communities are expected to absorb.23
Neutral on paper, unequal in practice
One of the easiest ways to preserve an unequal system is to make it look neutral at the point of law. That is where Dorothy Brown’s work is especially useful. Brown has argued, persuasively and with the patience of a tax scholar rather than the bombast of a campaign surrogate, that many federal tax provisions look race-neutral while rewarding patterns of marriage, homeownership, retirement saving, inheritance, and employment that history distributed unevenly by race. In Senate testimony, she put the point bluntly: the tax laws in question were written during periods when American law and policy openly favored white Americans, and we should not be surprised that their benefits still track older distributions of wealth and opportunity.24
That is a more serious way to talk about “neutrality” than the usual partisan exchange. The issue is not whether Congress inserted the words “white” and “Black” into today’s statutory text. The issue is whether the law rewards activities that are already unequally available because the underlying assets were distributed by prior law and prior exclusion. A deduction for mortgage interest, for example, is formally race-neutral. It is not race-neutral in effect if access to homeownership and home equity was built through decades of segregated credit, redlining, exclusionary zoning, and racial wealth gaps. The same is true of retirement preferences, favorable treatment of capital gains, pass-through business benefits, and the large tax subsidy for employer-provided health insurance. A law can be facially neutral and still reproduce a racially ordered distribution.25
Augusta’s local contrast makes that easier to see. Columbia County’s higher median income is only part of the story. Higher rates of owner occupancy, stronger access to stable employer coverage, and greater ability to accumulate home equity mean more households there are positioned to benefit from the kinds of tax preferences that arrive through ownership or through higher incomes. In Richmond County, by contrast, more households meet the state first not as owners but as wage earners, tenants, or debtors. They encounter the system through withholding, rent, copays, utility bills, and sales taxes. The difference is not merely how much money people make. It is how they are located within the structure of assets and risk.26
This is also why I do not find it analytically serious when politicians of either party try to explain the public’s economic distress solely through the price level or through one year’s tax tables. Inflation is real. Price shocks matter. But a household with assets experiences inflation differently from a household with only wages. A household with home equity, investment income, and good employer insurance is standing on a very different floor from a household that rents, relies on hourly work, and lives without much financial slack. The tax code did not create all of that. It did, however, help sort advantage toward one kind of household and fragility toward another.27
The tax state and the racial audit
The same pattern appears even more starkly in enforcement. The simplest income to tax is wage income reported on a W-2, with withholding already built in. The hardest income to tax is income that is complex, lightly reported, routed through business entities, tied to valuation, timing, basis, capital gains, partnerships, rents, royalties, or self-employment. The IRS’s own tax-gap work says as much. Misreporting is tiny where income is subject to both withholding and information reporting; it is far higher where income is not. The gross federal tax gap for tax year 2022 was nearly $700 billion. Much of it came from precisely the categories of income that are hardest to see.28
That alone would be enough to explain why IRS cuts are not neutral. But the racial dimension sharpens the point. Stanford researchers, using administrative data and machine-learning methods approved by the IRS, found that Black taxpayers were audited at roughly 2.9 to 4.7 times the rate of non-Black taxpayers. The disparity was driven largely by correspondence audits tied to the Earned Income Tax Credit. Black taxpayers made up about 21 percent of EITC claimants but 43 percent of EITC audits. If the agency had prioritized the magnitude of likely underreporting rather than the cheapness of low-level correspondence audits, more non-Black taxpayers would have been selected.29
That is one of the clearest examples in contemporary public life of a structure that is racist in operation even without an officer standing at a podium announcing racist intent. The discriminatory effect was predictable. It was measurable. It followed from administrative choices that favored low-cost auditing of simple claims disproportionately filed by Black taxpayers rather than higher-cost auditing of complex, higher-dollar forms of noncompliance. One need not presume omniscience about private hearts to describe that arrangement accurately. The state chose the easier target.30
The moral contrast is remarkable. A low-income worker claiming a modest refundable credit is subjected to a high level of scrutiny because the claim is legible and cheap to challenge. Meanwhile, complex higher-end underreporting is harder to police and therefore policed less. The National Taxpayer Advocate has repeatedly noted that low-income correspondence audits are often resolved without the taxpayer ever successfully engaging the process. When Congress weakens the IRS, it does not simply produce a random decline in enforcement. It shifts the practical tax system toward visible wage earners and away from harder-to-detect wealth. That is a class story. In the United States, and especially in a majority-Black county like Richmond, it is also unavoidably a race story.31
This is the point at which some readers become uncomfortable with the word “racist,” because they have been trained to think that racism exists only where explicit slurs or confessions of animus can be produced. That standard is intellectually unserious. Structural-racism research now defines racism not merely as prejudice in private hearts but as the total set of mutually reinforcing institutions that distribute resources, exposure, and sanction along racial lines. Where effects are predictable, persistent, and repeatedly maintained, naming them is not rhetorical excess. It is analytic honesty. And when officeholders, after being shown those effects, insist that race has nothing to do with the policy before them, they are not clarifying the debate. They are lying politely.32
Health care as a hidden tax on labor
The same logic runs through health care. Americans are told, constantly, that this is a country of mobility and risk-taking, a place where anyone can leave a job, start a business, and reinvent a life. That is a fantasy for millions of people with medical needs, dependent children, chronic illness, or spouses and relatives who rely on their coverage. Employment-based health insurance is one of the least examined restraints on economic freedom in the United States, perhaps because it is so often described as a benefit rather than as a tether.33
The history is less noble than the rhetoric. Employer-sponsored insurance hardened during and after World War II through wage controls, tax rulings, and collective bargaining. It was not designed as a coherent national system; it was improvised and then subsidized. The federal government still heavily subsidizes it through the tax code. Treasury says the exclusion of employer contributions for medical insurance is the largest tax expenditure in the federal budget for fiscal year 2026, at $296 billion. CBO projects that federal subsidies for employment-based coverage will total trillions over the decade. In other words, this is not some odd side arrangement. It is one of the principal ways the state organizes access to care.34
That organization is strange on its face. Why should a firm that makes software, soft drinks, or truck parts also have to be in the health-insurance business? Why should economic mobility require the household to risk losing access to doctors, prescriptions, specialists, or financial protection against catastrophe? RAND has long documented “job lock,” and more recent work found that when the Affordable Care Act expanded access to non-employer coverage, self-employment rose among adults with high demand for health insurance and no alternative source of coverage. That is exactly what one would expect in a country where insurance is a labor-market tether.35
The burden falls differently depending on where one sits in the structure. KFF’s 2025 employer survey found that only 61 percent of firms with ten or more workers offer health benefits at all, with much higher offer rates among large employers than small ones. The average annual premium for family coverage reached $26,993, with workers paying $6,850 on average toward that premium. For smaller firms, worker contributions can be even higher. In a metro like Augusta, where there are far more nonemployer establishments than employer establishments in Richmond County, the system is misaligned with the actual shape of local economic life.36
The burden is also racialized. Nationally, Black adults are more likely than white adults to carry medical debt. The burden is highest in the South. KFF estimates that Americans owe at least $220 billion in medical debt. Georgia is among the states with the heaviest burden. In Richmond County, the under-65 uninsured rate remains high. That is not just a health-policy fact. It is a local economic fact. A family managing medical debt, unstable coverage, or coverage tied to an employer it cannot afford to leave is not free in any serious sense of the word.37
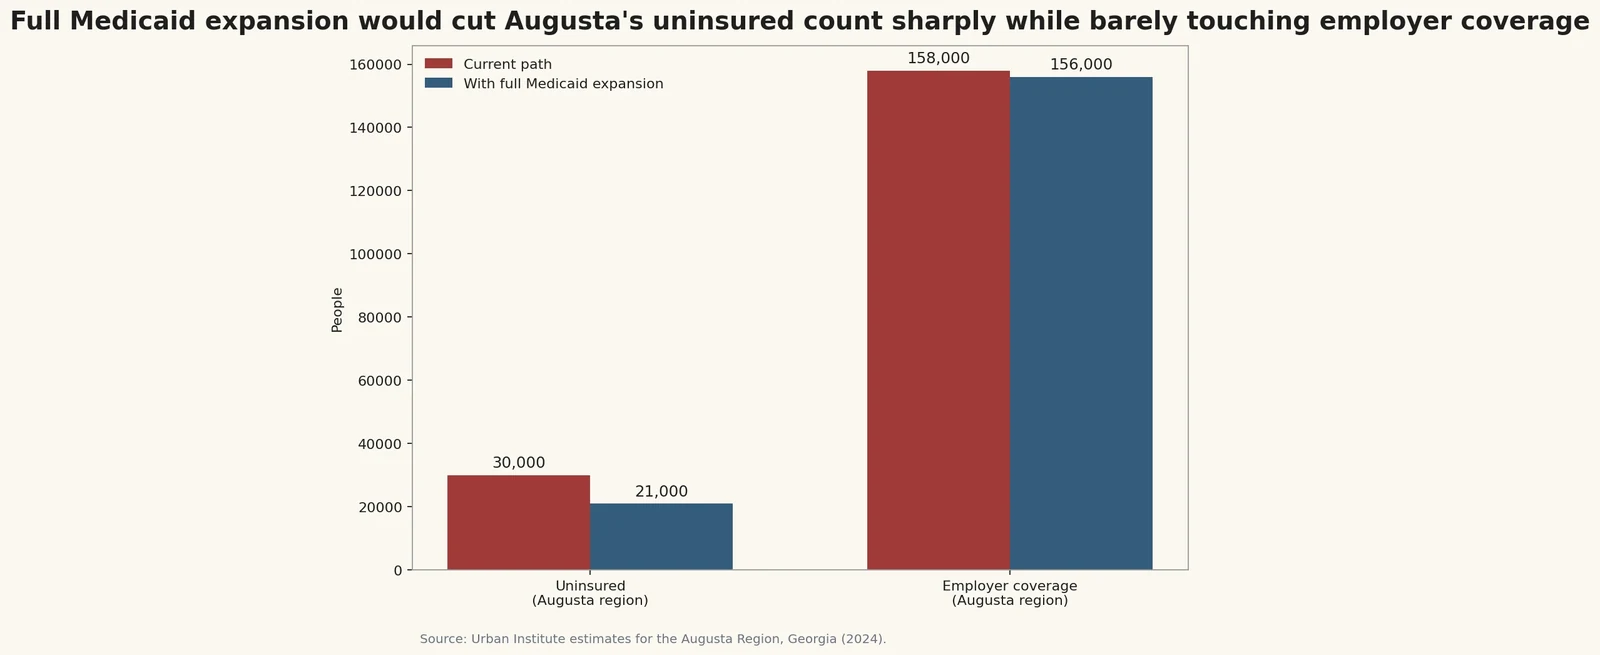
Georgia’s own Medicaid choices sharpen the local story. Urban Institute estimates that full Medicaid expansion would substantially reduce the number of uninsured people in the Augusta region while displacing relatively little employer coverage. The state instead built Pathways, a work-conditioned partial program that Georgia Budget and Policy Institute found had enrolled only 8,077 people after its first two years, with many denials tied to administrative and reporting barriers. That is the structure again: care treated as something to be earned by proper paperwork, work discipline, and moral qualification, even in a state where many uninsured people are already working, caregiving, or otherwise structurally exposed. The language is moral. The machinery is administrative. The effect is material. David Graeber understood this kind of arrangement better than most policy analysts. Bureaucracy, on his account, does not eliminate power; it regularizes it, diffuses responsibility, and disguises domination as procedure. That is a useful description of Pathways as well as of the low-cost audit state: the coercion is real, but it arrives as a portal, a missing document, a deadline, or a technically neutral denial.38
You can smell a structure
There is a line people use in Augusta that can sound exaggerated until one remembers the record: you can smell poverty in this town. Taken literally, that statement can be unfair to particular neighborhoods. Taken historically, it is disturbingly precise.39
The old redlining and community-survey materials described parts of Black Augusta in the language of disease and odor. The Terry was identified as a typhoid hazard. Area descriptions referred to open sewers and obnoxious odors. Contemporary environmental-equity work does not use the same language, but it often describes the same broad logic: heavier industrial and environmental burdens concentrated in the places with less political insulation. The Savannah Riverkeeper/E2I2 report finds that 30901, 30904, and 30906 face the greatest overall burdens among the ZIP codes it examined, while also emphasizing that ZIP codes are blunt instruments whose boundaries do not cleanly track census tracts.40
That caveat is not a technical aside. It is central to understanding Augusta. 30904 contains some of the city’s most prized terrain, including much of what people mean when they say “the Hill.” It also contains less protected space. That mixed ZIP code is a useful corrective to the bad local habit of flattening neighborhoods into stereotypes. But it is also a useful illustration of the larger point. Augusta does not distribute protection and exposure in a simple checkerboard. It layers them, compresses them, and often makes them adjacent. One ZIP code can contain old insulation, Black history, present privilege, and measurable burden. That is not a reason to abandon the analysis. It is a reason to conduct it carefully.41
If one wants the larger pattern rather than the crude shorthand, it is already visible. The city’s industrial and environmental burdens are heaviest in and around the poorer and more heavily Black parts of Augusta. The political geography often fragments responsibility, while the physical effects of pollution do not respect district lines, ZIP codes, or neighborhood myths. Fine particulates do not care about campaign mailers. Water and air do not obey the fictions by which political elites manage blame.42
The politics of not knowing
At this point the story stops looking contradictory and starts looking uncomfortably simple. The public is pressured by a structure that sorts risk downward and advantage upward. Race is part of that sorting, not an incidental decoration. The language used to describe the structure is deliberately misleading. And both parties, in different ways, help maintain that arrangement.43
Republicans are usually cruder about it. Lee Atwater’s infamous explanation of Southern political rhetoric remains useful not because it revealed something novel, but because it stated openly what many people preferred to hear only in code: once overt racial language became politically costly, the appeals became more abstract—forced busing, states’ rights, and eventually “cutting taxes,” with the same disparate results and a more respectable surface. That remark is still a better guide to a large portion of American political language than most Sunday talk shows.44
The contemporary right often prefers immigrants as its all-purpose culprit. In Richmond County, where only 3.8 percent of residents are foreign-born, that story is analytically weak. The older regional substitute is much easier to see: hostility toward Black people, panic about disorder, suspicion of public aid, moral disgust toward the poor, and the persistent idea that social protection is indulgence while punishment is realism. One does not have to guess about the political genealogy. It is written into the rhetoric and the policy design.45
Democrats are different, but not innocent. They are more likely to describe the pain accurately and then propose repairs that leave the deeper ownership structure intact. A politics that says Republicans are merely greedy can be as evasive as a politics that says immigrants are the problem. Greed is real; it is not a sufficient explanation for a structure repeatedly written into law by both parties. The Clinton-era promise to “end welfare as we know it” remains an indispensable example because it showed Democrats accepting a language of deservedness and work discipline already saturated with racial meaning. Martin Gilens’s work on welfare opinion made the underlying mechanism painfully clear: American views on welfare were not merely skeptical; they were racially charged, shaped by stereotype and media misrepresentation, and especially responsive to narratives about the undeserving poor. Democrats did not invent that structure. They often helped stabilize it in more respectable language.46
That is where James Baldwin remains more useful than a great deal of present commentary. Baldwin wrote that Black Americans are “always aware of the enormous gap between election promises and their daily lives.” He also wrote, in a passage that should haunt any serious discussion of representation, that Black politicians are often regarded with pride as politicians, yet become “ever more removed from the people” they ostensibly serve, because their position can become dependent on the continuing debasement of those below. That is not an argument against Black officeholders. It is an argument against confusing symbolic advancement within unchanged institutions for transformation of the institutions themselves.47
Baldwin was equally incisive about the costs of white ignorance. “Whatever white people do not know about Negroes,” he wrote, “reveals, precisely and inexorably, what they do not know about themselves.” That line is not only moral. It is sociological. The subordinate almost always learns more about power than power learns about the subordinate. In slavery, that asymmetry was brutal and literal: survival required close attention to the shifting moods of the master, while the master could afford ignorance. The structure did not end with emancipation. It changed forms.48
Modern research points in the same direction. Studies on the psychosocial costs of racism to Whites argue that racism harms not only its direct victims but also the dominant group through fear, guilt, diminished empathy, distorted cognition, and damaged relationships. Research on racism and social capital similarly suggests that racial hierarchy corrodes trust and civic life. This is not a claim of symmetry. The victim bears the material and bodily burden. The perpetrator inherits a thinner moral and civic life. Baldwin understood that long before the psychological literature gave it scales and subscales.49
Angela Davis has perhaps the simplest phrase for the larger system: “capitalism is racial capitalism.” The value of that phrase is not its rhetorical charge but its explanatory power. It tells the truth about the structure more clearly than a thousand euphemisms about “the market,” “growth,” “incentives,” or “human nature.” The economy is not merely unequal and then separately racist. In the United States, and certainly in Augusta, much of the inequality has been organized through race, while race has been repeatedly stabilized through economic arrangements that appear neutral only if one refuses to ask how the underlying assets were distributed.50
What Augusta knows
Augusta knows this more deeply than it is usually allowed to say aloud. It knows that one can live in a beautiful city and still watch its burdens fall predictably. It knows that protection and exposure are not distributed by providence. It knows that one county can carry poverty, higher uninsured rates, and greater vulnerability while the county next door accumulates insulation. It knows that the Hill is not only a pretty neighborhood but a clue. It knows that the city’s physical landscape records old choices about who was to be nearer fever, industry, odor, policing, and debt, and who was to be farther from them.51
It also knows, or should know, that the public is not stupid. People do not need to be patronized into understanding their own hardship. They need a truer account of what has made that hardship durable. The affordability problem is not simply that prices are high. It is that the society has built a structure in which wages are visible, taxed, and policed; health security is tied to employment; capital gains and ownership are privileged; environmental risk is pushed toward the less powerful; and racial hierarchy remains available as a language of explanation even when it changes dialect.52
That is why the rhetoric changes every election while the pressure remains. Republicans more often intensify the structure, defend it more directly, or weaponize it through demagoguery. Democrats more often describe the damage honestly and then decline to reach the level of structure, preferring mitigation to reconstruction. The differences are real. The continuity is also real. One party speaks more openly in the language of hierarchy. The other often manages hierarchy while promising inclusion. Neither has seriously invited the country to look at the full architecture at once.53
The result is a politics that mistakes symptoms for causes and gesture for remedy. It is also a moral failure. A society should be judged from the underside, by what it demands of those with the least room to absorb risk and by the stories it tells to justify those demands. Tax Day is a useful date for remembering that because the ritual encourages us to imagine that the state’s main economic relationship to ordinary life is the filing of a return. In truth, the deeper relationship is everywhere: in wages, in health care, in debt, in land, in the placement of industry, in the policing of claims, in who is granted the dignity of complexity and who is forced into administrative exposure.54
The Christian tradition I take seriously is not the one that blesses hierarchy and then calls the result morality. It is the one that judges power by what it does to the poor. “The Spirit of the Lord is upon me,” Jesus says in Luke, “because he has anointed me to bring good news to the poor … to let the oppressed go free.” That is not a campaign slogan and it is not a tax policy white paper. It is, however, a better standard than most of what passes for serious economic argument in American public life.55
The work ahead is not to wait for a cleaner villain, a cleverer slogan, or one more slightly modified tax bill. It is to learn to describe the structure accurately enough that its contradictions stop looking inevitable. Augusta can help with that, because the city still makes the system visible. The map, the air, the wages, the debt, the county line, the Hill, the old red lines, the new medical bills, the tax return that changes too little and explains even less—all of them point in the same direction. Once the lens is tilted the right way, the story becomes much less confusing. Not easier to accept, perhaps. But much easier to understand.
Notes
- Tax Policy Center, “House Tax Cuts Would Benefit Most but Tilt to Highest-Income Households,” https://taxpolicycenter.org/taxvox/house-tax-cuts-would-benefit-most-tilt-highest-income-households; Congressional Budget Office, “Preliminary Analysis of the Distributional Effects of the One Big Beautiful Bill Act,” https://www.cbo.gov/system/files/2025-05/61422-Reconciliation-Distributional-Analysis.pdf. ↩︎
- Tax Policy Center, “2025 Tax Cuts Tracker,” https://taxpolicycenter.org/features/2025-tax-cuts-tracker; Congressional Budget Office, “Preliminary Analysis of the Distributional Effects of the One Big Beautiful Bill Act,” https://www.cbo.gov/system/files/2025-05/61422-Reconciliation-Distributional-Analysis.pdf. ↩︎
- U.S. Census Bureau, QuickFacts: Richmond County, Georgia, https://www.census.gov/quickfacts/fact/table/richmondcountygeorgia/PST045224; U.S. Census Bureau, QuickFacts: Columbia County, Georgia, https://www.census.gov/quickfacts/fact/table/columbiacountygeorgia/PST120224. ↩︎
- U.S. Census Bureau, QuickFacts: Richmond County, Georgia, https://www.census.gov/quickfacts/fact/table/richmondcountygeorgia/PST045224. ↩︎
- Zinzi Bailey et al., “Structural racism and health inequities in the USA,” The Lancet, https://www.thelancet.com/journals/lancet/article/PIIS0140-6736%2817%2930569-X/fulltext; David R. Williams et al., “Systemic And Structural Racism,” Health Affairs, https://www.healthaffairs.org/doi/10.1377/hlthaff.2021.01394. ↩︎
- Peter Townsend / David Gordon, “Relative Deprivation Theory,” University of Bristol Poverty Institute, https://www.bristol.ac.uk/media-library/sites/poverty-institute/documents/Relative%20Deprivation%20Theory%20%28David%20Gordon%29.pdf. ↩︎
- David Gordon, “Relative Deprivation Theory,” https://www.bristol.ac.uk/media-library/sites/poverty-institute/documents/Relative%20Deprivation%20Theory%20%28David%20Gordon%29.pdf; National Academies of Sciences, Engineering, and Medicine, Communities in Action, https://nap.nationalacademies.org/resource/24624/RootCausesofHealthInequity/; Joey T. Cheng et al., “The association between objective and subjective socioeconomic status and subjective well-being,” https://ink.library.smu.edu.sg/soss_research/3244/. ↩︎
- David Gordon, “Relative Deprivation Theory,” https://www.bristol.ac.uk/media-library/sites/poverty-institute/documents/Relative%20Deprivation%20Theory%20%28David%20Gordon%29.pdf. ↩︎
- Federal Reserve Board, “Economic Well-Being of U.S. Households in 2024,” https://www.federalreserve.gov/publications/2025-economic-well-being-of-us-households-in-2024-executive-summary.htm. ↩︎
- U.S. Census Bureau, QuickFacts: Richmond County, Georgia, https://www.census.gov/quickfacts/fact/table/richmondcountygeorgia/PST045224; U.S. Bureau of Labor Statistics, “Occupational Employment and Wages in Augusta-Richmond County, GA-SC — May 2024,” https://www.bls.gov/regions/southeast/news-release/occupationalemploymentandwages_augusta.htm. ↩︎
- Congressional Budget Office, “The Distribution of Household Income, 2022,” https://www.cbo.gov/publication/61911; Congressional Budget Office, “Trends in the Distribution of Family Wealth, 1989 to 2022,” https://www.cbo.gov/publication/60343. ↩︎
- Congressional Budget Office, “Trends in the Distribution of Family Wealth, 1989 to 2022,” https://www.cbo.gov/publication/60343. ↩︎
- Pew Research Center, “The State of the American Middle Class,” https://www.pewresearch.org/race-and-ethnicity/2024/05/31/the-state-of-the-american-middle-class/. ↩︎
- Thomas Piketty, “Capital and Ideology,” https://piketty.pse.ens.fr/files/Piketty2021BJS.pdf; Daron Acemoglu, “Institutions, Technology, and Prosperity,” Nobel Prize lecture, https://www.nobelprize.org/uploads/2025/01/acemoglu-lecture.pdf. ↩︎
- Internal Revenue Service, “The Distribution of Capital Gains in the United States,” https://www.irs.gov/pub/irs-soi/25rpdistcapgain.pdf; Congressional Budget Office, “The Distribution of Major Tax Expenditures in 2019,” https://www.cbo.gov/publication/57585; Internal Revenue Service, Topic No. 751, “Social Security and Medicare withholding rates,” https://www.irs.gov/taxtopics/tc751; Social Security Administration, 2026 COLA fact sheet, https://www.ssa.gov/news/en/cola/factsheets/2026.html. ↩︎
- Tax Policy Center, “House Tax Cuts Would Benefit Most but Tilt to Highest-Income Households,” https://taxpolicycenter.org/taxvox/house-tax-cuts-would-benefit-most-tilt-highest-income-households; Congressional Budget Office, “Preliminary Analysis of the Distributional Effects of the One Big Beautiful Bill Act,” https://www.cbo.gov/system/files/2025-05/61422-Reconciliation-Distributional-Analysis.pdf. ↩︎
- Georgia Department of Revenue, 2025 Form 500 instructions/form (showing the 5.19% rate for tax year 2025), https://apps.dor.ga.gov/FillableForms/webpdf/examples/2025GA500.pdf; Georgia Department of Revenue, “Sales Tax Rates – General,” https://dor.georgia.gov/sales-tax-rates-general; IRS Topic No. 751, https://www.irs.gov/taxtopics/tc751. ↩︎
- New Georgia Encyclopedia, “Slavery in Antebellum Georgia,” https://www.georgiaencyclopedia.org/articles/history-archaeology/slavery-in-antebellum-georgia/; Gerald R. Webster and Jerrod Bowman, “Quantitatively Delineating the Black Belt Geographic Region,” Southeastern Geographer 48, no. 1 (2008), JSTOR, https://www.jstor.org/stable/26225503. ↩︎
- Augusta, Georgia, official “Arsenal Cemetery” page, https://www.augustaga.gov/348/Arsenal; Augusta Museum of History, “Augusta Arsenal,” https://www.augustamuseum.org/Augusta-Arsenal. ↩︎
- Augusta, Georgia, official “Fitten Street Cemetery” page, https://www.augustaga.gov/354/Fitten-Street. ↩︎
- Savannah Riverkeeper and Environmental Equity Information Institute, “Community Data Profile: Augusta,” https://www.savannahriverkeeper.org/uploads/1/0/7/7/10770018/community_data_profile_augusta_october_31_2024_e2i2__1_.pdf. ↩︎
- University of Richmond, Mapping Inequality: Augusta context page, https://dsl.richmond.edu/panorama/redlining/map/GA/Augusta/context; University of Richmond, D-11 area description, https://dsl.richmond.edu/panorama/redlining/map/GA/Augusta/area_descriptions/D11. ↩︎
- Charles Rollins, “Augusta Is One Body: How Division Still Shapes the City,” Garden City Gossip, https://gardencitygossip.com/augusta-ga-inequality-environmental-justice/. ↩︎
- Professor Dorothy A. Brown, testimony before the Senate Finance Committee, https://www.finance.senate.gov/imo/media/doc/Professor%20Dorothy%20Brown%20Testimony.pdf. ↩︎
- Dorothy A. Brown testimony, https://www.finance.senate.gov/imo/media/doc/Professor%20Dorothy%20Brown%20Testimony.pdf; Williams et al., “Systemic And Structural Racism,” Health Affairs, https://www.healthaffairs.org/doi/10.1377/hlthaff.2021.01394. ↩︎
- U.S. Census Bureau, QuickFacts: Richmond County, Georgia, https://www.census.gov/quickfacts/fact/table/richmondcountygeorgia/PST045224; U.S. Census Bureau, QuickFacts: Columbia County, Georgia, https://www.census.gov/quickfacts/fact/table/columbiacountygeorgia/PST120224. ↩︎
- Congressional Budget Office, “The Distribution of Household Income, 2022,” https://www.cbo.gov/publication/61911; Congressional Budget Office, “The Distribution of Major Tax Expenditures in 2019,” https://www.cbo.gov/publication/57585. ↩︎
- Internal Revenue Service, “Tax Gap Projections for Tax Years 2022–2024,” Publication 5869, https://www.irs.gov/pub/irs-pdf/p5869.pdf. ↩︎
- Stanford Institute for Economic Policy Research, “IRS disproportionately audits Black taxpayers,” https://siepr.stanford.edu/news/irs-disproportionately-audits-black-taxpayers; Elzayn et al., working paper, https://dho.stanford.edu/wp-content/uploads/Audit_Disparities.pdf. ↩︎
- Stanford audit-disparities paper, https://dho.stanford.edu/wp-content/uploads/Audit_Disparities.pdf. ↩︎
- National Taxpayer Advocate, “Low-Income Taxpayers Encounter Communication Barriers That Hinder Correspondence Audit Resolution,” https://www.taxpayeradvocate.irs.gov/news/nta-blog/nta-blog-low-income-taxpayers-encounter-communication-barriers-that-hinder-correspondence-audit-resolution/2022/05/; U.S. Government Accountability Office, “Tax Compliance: Trends of IRS Audit Rates and Results for Individual Taxpayers by Income,” https://www.gao.gov/products/gao-22-104960. ↩︎
- Bailey et al., “Structural racism and health inequities in the USA,” https://www.thelancet.com/journals/lancet/article/PIIS0140-6736%2817%2930569-X/fulltext; Leonard Egede and Rebekah Walker, “Addressing Structural Inequalities, Structural Racism, and Social Determinants of Health,” https://pmc.ncbi.nlm.nih.gov/articles/PMC10897090/. ↩︎
- Margaret E. Blume-Kohout, “Entrepreneurship Lock and the Demand for Health Insurance,” ILR Review abstract page, https://ideas.repec.org/a/sae/ilrrev/v77y2024i2p199-226.html; RAND Corporation, “Does Employer-Based Health Insurance Discourage Entrepreneurship and New Business Creation?” https://www.rand.org/pubs/research_briefs/RB9579.html. ↩︎
- National Bureau of Economic Research, “Employer-Sponsored Health Insurance and Health Reform,” https://www.nber.org/bah/2009no2/employer-sponsored-health-insurance-and-health-reform; U.S. Department of the Treasury, “Tax Expenditures,” https://home.treasury.gov/policy-issues/tax-policy/tax-expenditures; Congressional Budget Office, “Federal Subsidies for Health Insurance: 2023 to 2033,” https://www.cbo.gov/publication/59613. ↩︎
- RAND Corporation, “Does Employer-Based Health Insurance Discourage Entrepreneurship and New Business Creation?” https://www.rand.org/pubs/research_briefs/RB9579.html; Blume-Kohout, “Entrepreneurship Lock and the Demand for Health Insurance,” https://ideas.repec.org/a/sae/ilrrev/v77y2024i2p199-226.html. ↩︎
- KFF, “2025 Employer Health Benefits Survey,” https://www.kff.org/health-costs/2025-employer-health-benefits-survey/; U.S. Census Bureau, QuickFacts: Richmond County, Georgia, https://www.census.gov/quickfacts/fact/table/richmondcountygeorgia/PST045224. ↩︎
- Peterson-KFF Health System Tracker, “The Burden of Medical Debt in the United States,” https://www.healthsystemtracker.org/brief/the-burden-of-medical-debt-in-the-united-states/; Consumer Financial Protection Bureau, “Medical Debt Burden in the United States,” https://www.consumerfinance.gov/data-research/research-reports/medical-debt-burden-in-the-united-states/; U.S. Census Bureau, QuickFacts: Richmond County, Georgia, https://www.census.gov/quickfacts/fact/table/richmondcountygeorgia/PST045224. ↩︎
- Urban Institute, “Expanding Medicaid in Georgia Would Help Uninsured People Gain Coverage,” https://www.urban.org/sites/default/files/2024-04/Expanding_Medicaid_in_Georgia_Would_Help_Uninsured_People_Gain_Coverage.pdf; Georgia Budget and Policy Institute, “Pathways to Coverage: Looking Back Two Years and Into the Future,” https://gbpi.org/pathways-to-coverage-looking-back-two-years-and-into-the-future/; David Graeber, *The Utopia of Rules*, book page, https://davidgraeber.org/books/the-utopia-of-rules/. ↩︎
- On the city’s long association between marginalized space, disease, and odor, see University of Richmond, Mapping Inequality Augusta context and D-11 area-description pages, https://dsl.richmond.edu/panorama/redlining/map/GA/Augusta/context and https://dsl.richmond.edu/panorama/redlining/map/GA/Augusta/area_descriptions/D11. ↩︎
- University of Richmond, Mapping Inequality Augusta pages, https://dsl.richmond.edu/panorama/redlining/map/GA/Augusta/context and https://dsl.richmond.edu/panorama/redlining/map/GA/Augusta/area_descriptions/D11; Savannah Riverkeeper/E2I2, “Community Data Profile: Augusta,” https://www.savannahriverkeeper.org/uploads/1/0/7/7/10770018/community_data_profile_augusta_october_31_2024_e2i2__1_.pdf. ↩︎
- Savannah Riverkeeper/E2I2, “Community Data Profile: Augusta,” especially the methods section on ZIP-code aggregation, https://www.savannahriverkeeper.org/uploads/1/0/7/7/10770018/community_data_profile_augusta_october_31_2024_e2i2__1_.pdf; Augusta’s Fitten Street Cemetery page, https://www.augustaga.gov/354/Fitten-Street; Augusta Arsenal history, https://www.augustaga.gov/348/Arsenal. ↩︎
- Savannah Riverkeeper/E2I2, “Community Data Profile: Augusta,” https://www.savannahriverkeeper.org/uploads/1/0/7/7/10770018/community_data_profile_augusta_october_31_2024_e2i2__1_.pdf; Rollins, “Augusta Is One Body,” https://gardencitygossip.com/augusta-ga-inequality-environmental-justice/. ↩︎
- For the broader structure tying housing, earnings, benefits, health care, and criminal justice into racialized outcomes, see Bailey et al., “Structural racism and health inequities in the USA,” https://www.thelancet.com/journals/lancet/article/PIIS0140-6736%2817%2930569-X/fulltext. ↩︎
- Rick Perlstein, “Exclusive: Lee Atwater’s Infamous 1981 Interview on the Southern Strategy,” The Nation, https://www.thenation.com/article/archive/exclusive-lee-atwaters-infamous-1981-interview-southern-strategy/. ↩︎
- U.S. Census Bureau, QuickFacts: Richmond County, Georgia, https://www.census.gov/quickfacts/fact/table/richmondcountygeorgia/PST045224. ↩︎
- Bill Clinton White House archive, “Welfare to Work,” https://clintonwhitehouse5.archives.gov/textonly/WH/New/html/19990803.html; Martin Gilens, *Why Americans Hate Welfare* (University of Chicago Press page), https://press.uchicago.edu/ucp/books/book/chicago/W/bo3633527.html; Martin Gilens, “Racial Attitudes and Opposition to Welfare,” JSTOR abstract, https://www.jstor.org/stable/2960399. ↩︎
- James Baldwin, “Journey to Atlanta” and “Notes of a Native Son,” in *Collected Essays* (Library of America), archived full text at https://archive.org/stream/JamesBaldwinCollectedEssaysLibraryOfAmerica1998/James%20Baldwin-Collected%20Essays-Library%20of%20America%20%281998%29_djvu.txt. ↩︎
- James Baldwin, “Letter from a Region in My Mind,” The New Yorker, https://www.newyorker.com/magazine/1962/11/17/letter-from-a-region-in-my-mind; James Baldwin, interview excerpt on hatred and fear, https://www.baldwinbibliography.com/uploads/1/0/7/2/107262851/jbr2024_b.pdf. ↩︎
- Lisa B. Spanierman and Mary J. Heppner, “Psychosocial Costs of Racism to Whites Scale (PCRW): Construction and Initial Validation,” Journal of Counseling Psychology 51, no. 2 (2004), ERIC abstract, https://eric.ed.gov/?id=EJ684874; Nolan L. Cabrera, V. Paul Poteat, and Lisa B. Spanierman, “Longitudinal Examination of the Psychosocial Costs of Racism to Whites Across the College Experience,” PubMed abstract, https://pubmed.ncbi.nlm.nih.gov/21859188/; Caroline R. Efird, Clara L. Wilkins, and H. Shellae Versey, “Whiteness hurts society: How whiteness shapes mental, physical, and social health outcomes,” Journal of Social Issues (2024) PDF, https://depts.washington.edu/spia/wordpress/wp-content/uploads/2024/03/Journal-of-Social-Issues-2024-Efird-Whiteness-hurts-society-How-whiteness-shapes-mental-physical-and-social-health.pdf; Nina Brondolo et al., “Racism and Social Capital: The Implications for Social and Physical Well-Being,” Journal of Social Issues PDF, https://sites.rutgers.edu/risclab/wp-content/uploads/sites/906/2025/01/Brondolo-Libretti-Rivera-et-al-2012_Jrnl-of-Social-Issues.pdf. ↩︎
- Angela Davis, “Capitalism is Racial Capitalism,” interview transcript, https://www.ajplus.net/stories/angela-davis-on-racial-capitalism. ↩︎
- U.S. Census Bureau, QuickFacts: Richmond County, Georgia, https://www.census.gov/quickfacts/fact/table/richmondcountygeorgia/PST045224; U.S. Census Bureau, QuickFacts: Columbia County, Georgia, https://www.census.gov/quickfacts/fact/table/columbiacountygeorgia/PST120224; Augusta Arsenal history, https://www.augustaga.gov/348/Arsenal; Savannah Riverkeeper/E2I2, https://www.savannahriverkeeper.org/uploads/1/0/7/7/10770018/community_data_profile_augusta_october_31_2024_e2i2__1_.pdf. ↩︎
- Internal Revenue Service, Publication 5869, https://www.irs.gov/pub/irs-pdf/p5869.pdf; Treasury tax expenditures, https://home.treasury.gov/policy-issues/tax-policy/tax-expenditures; Savannah Riverkeeper/E2I2, https://www.savannahriverkeeper.org/uploads/1/0/7/7/10770018/community_data_profile_augusta_october_31_2024_e2i2__1_.pdf. ↩︎
- Perlstein, Atwater interview, https://www.thenation.com/article/archive/exclusive-lee-atwaters-infamous-1981-interview-southern-strategy/; Clinton White House archive, “Welfare to Work,” https://clintonwhitehouse5.archives.gov/textonly/WH/New/html/19990803.html; Davis interview, https://www.ajplus.net/stories/angela-davis-on-racial-capitalism. ↩︎
- National Academies, Communities in Action, https://nap.nationalacademies.org/resource/24624/RootCausesofHealthInequity/; David Graeber, *Debt: The First 5,000 Years*, book page, https://davidgraeber.org/books/debt-the-first-5000-years/. ↩︎
- Luke 4:18 (NRSV/NRSVUE), https://www.biblegateway.com/passage/?search=Luke+4%3A18&version=NRSVUE; see also https://bible.oremus.org/?passage=Luke+4%3A18&version=nrsv. ↩︎